Who are we?
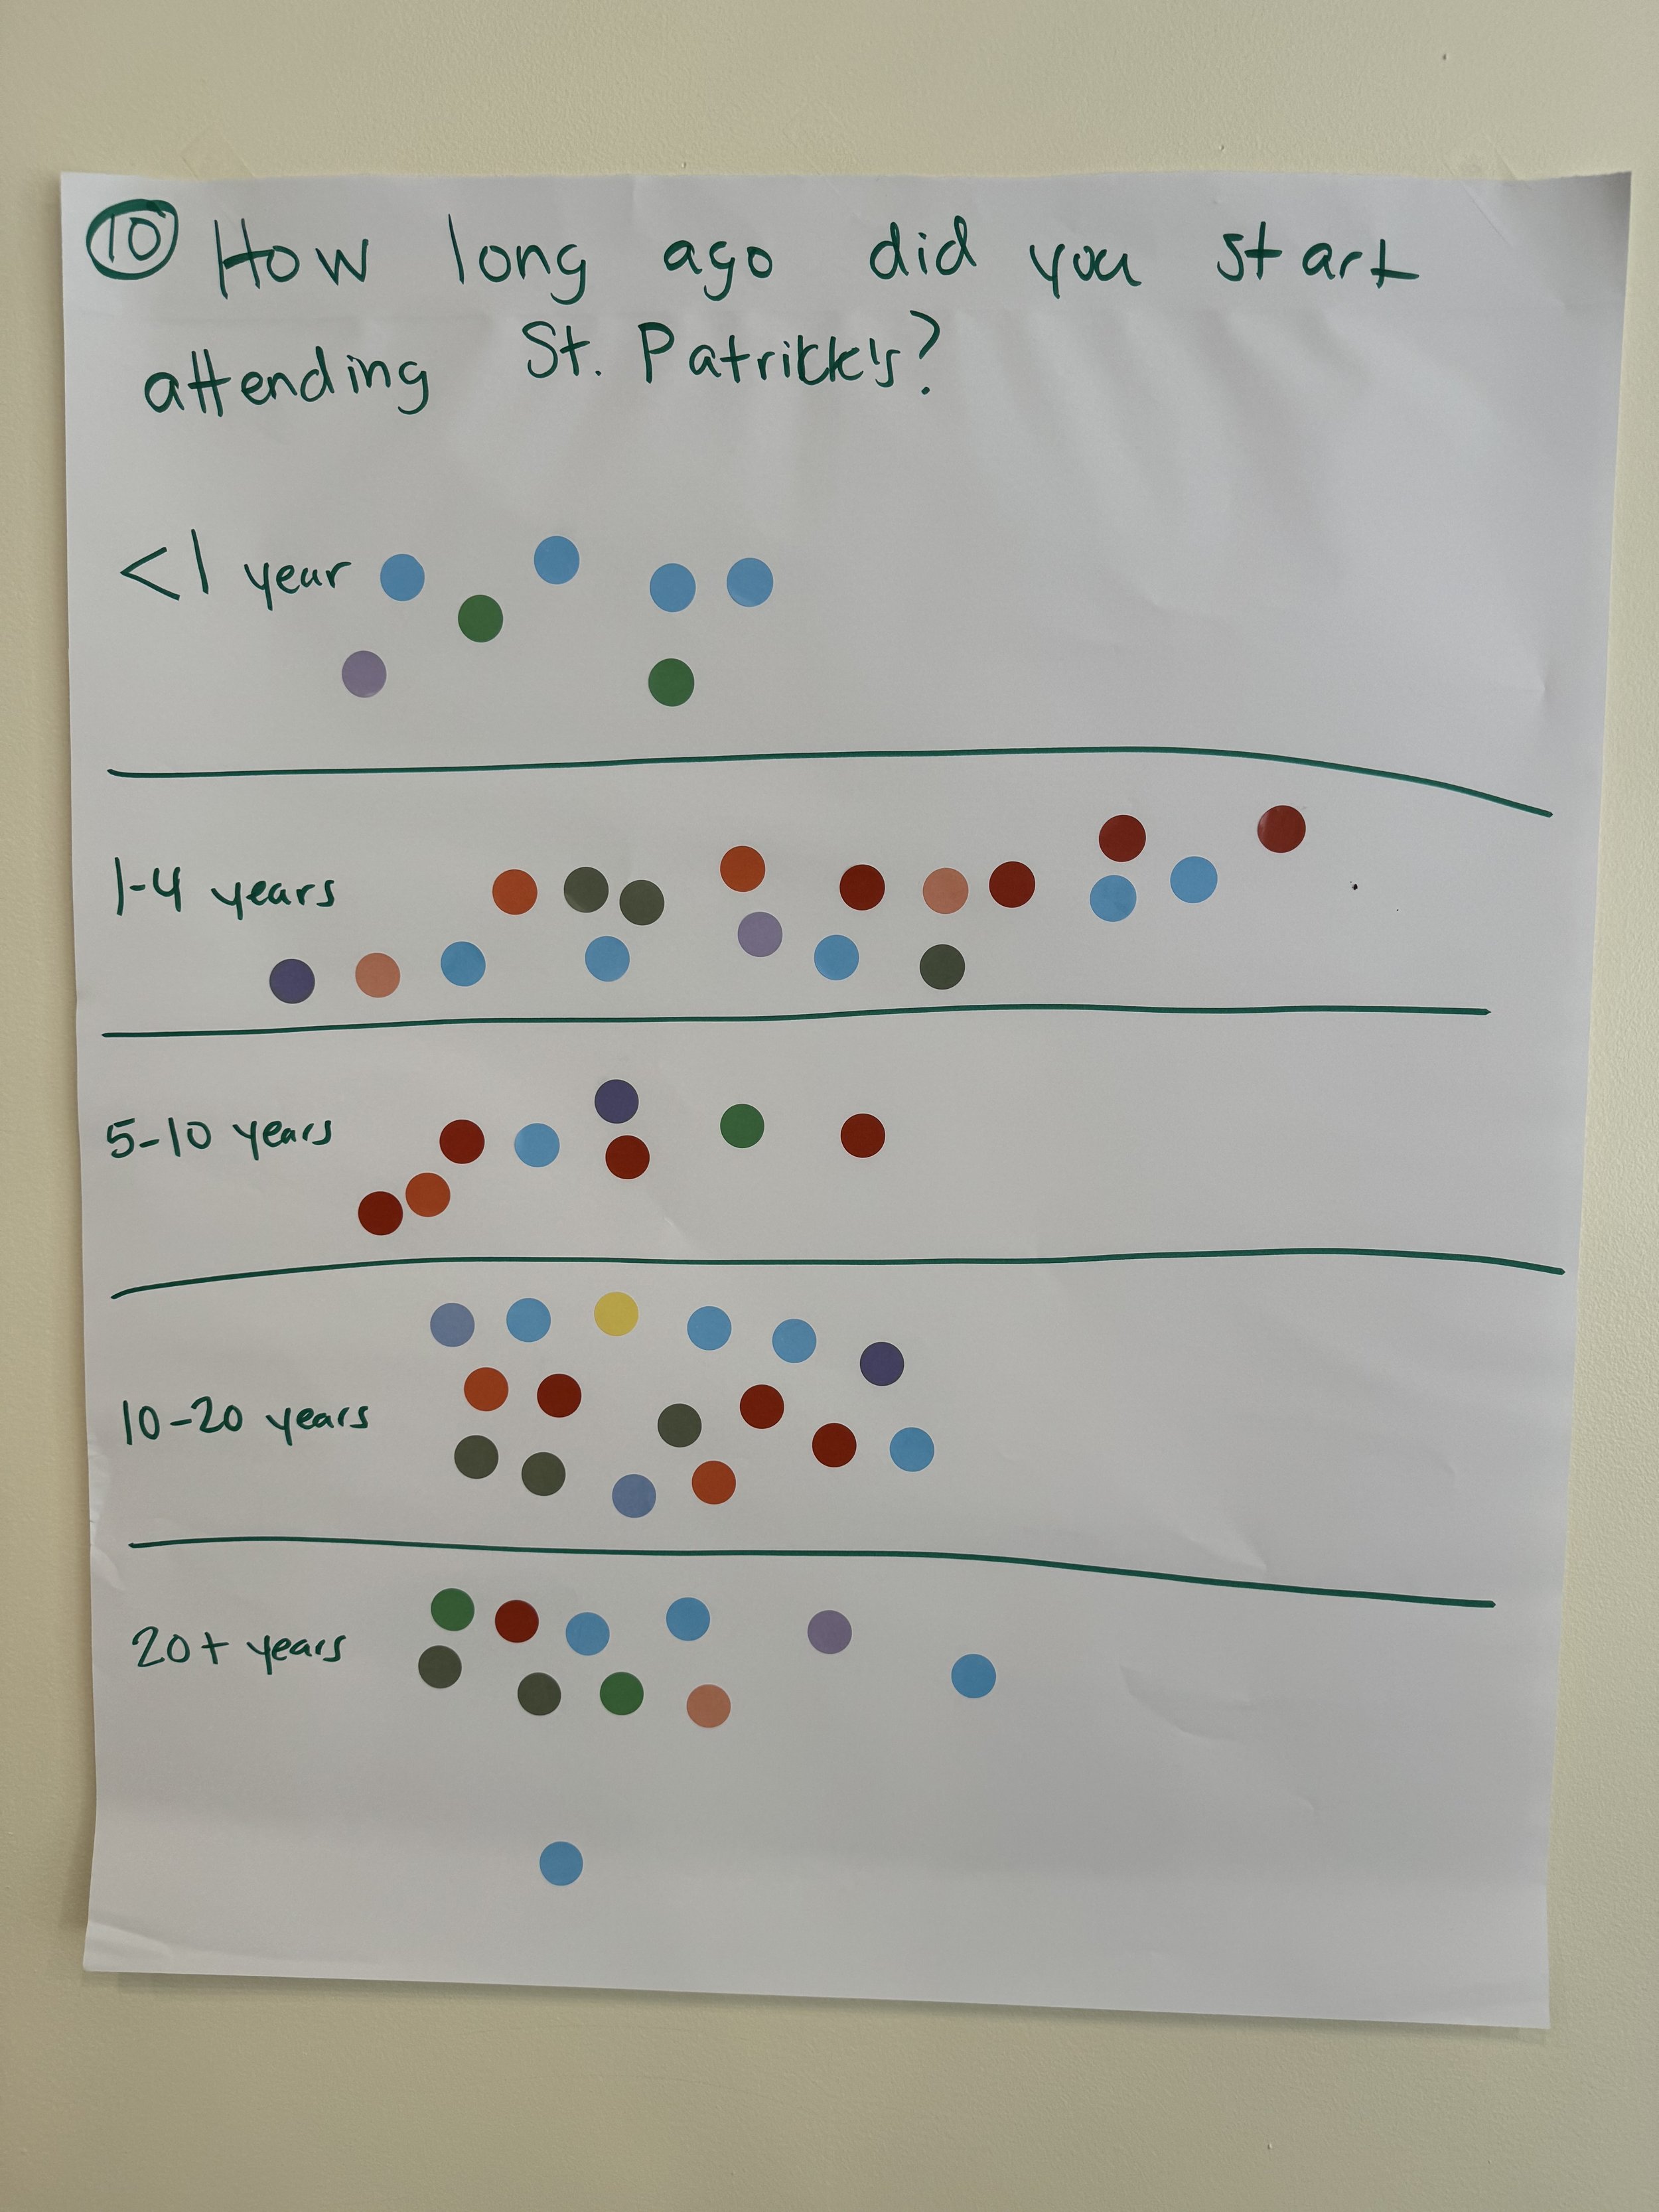
To kick off our adult formation series around Civil Discourse, we took some inventory of who we are, asking worshippers to respond to some demographic questions with stickers.
Not everyone at worship completed the survey.
Not every question had the exact same number of responses meaning some respondants must have skipped questions or answered some questions twice.
Your rector took statistics in college, but it was one of the worst grades on her transcript so please use these results for entertainment purposes only.
The average St. Patrick’s parishioner: Was born outside of Ohio in a state that does not border Ohio, does not have a tattoo, has a bachelor’s degree, was baptized between 0 and 4 years old, grew up Roman Catholic, is currently retired, has one sibling, listened to music on their record player as a teenager, opens presents on Christmas Day and began attending St. Patrick’s 1-4 years ago.
Explore the results below:
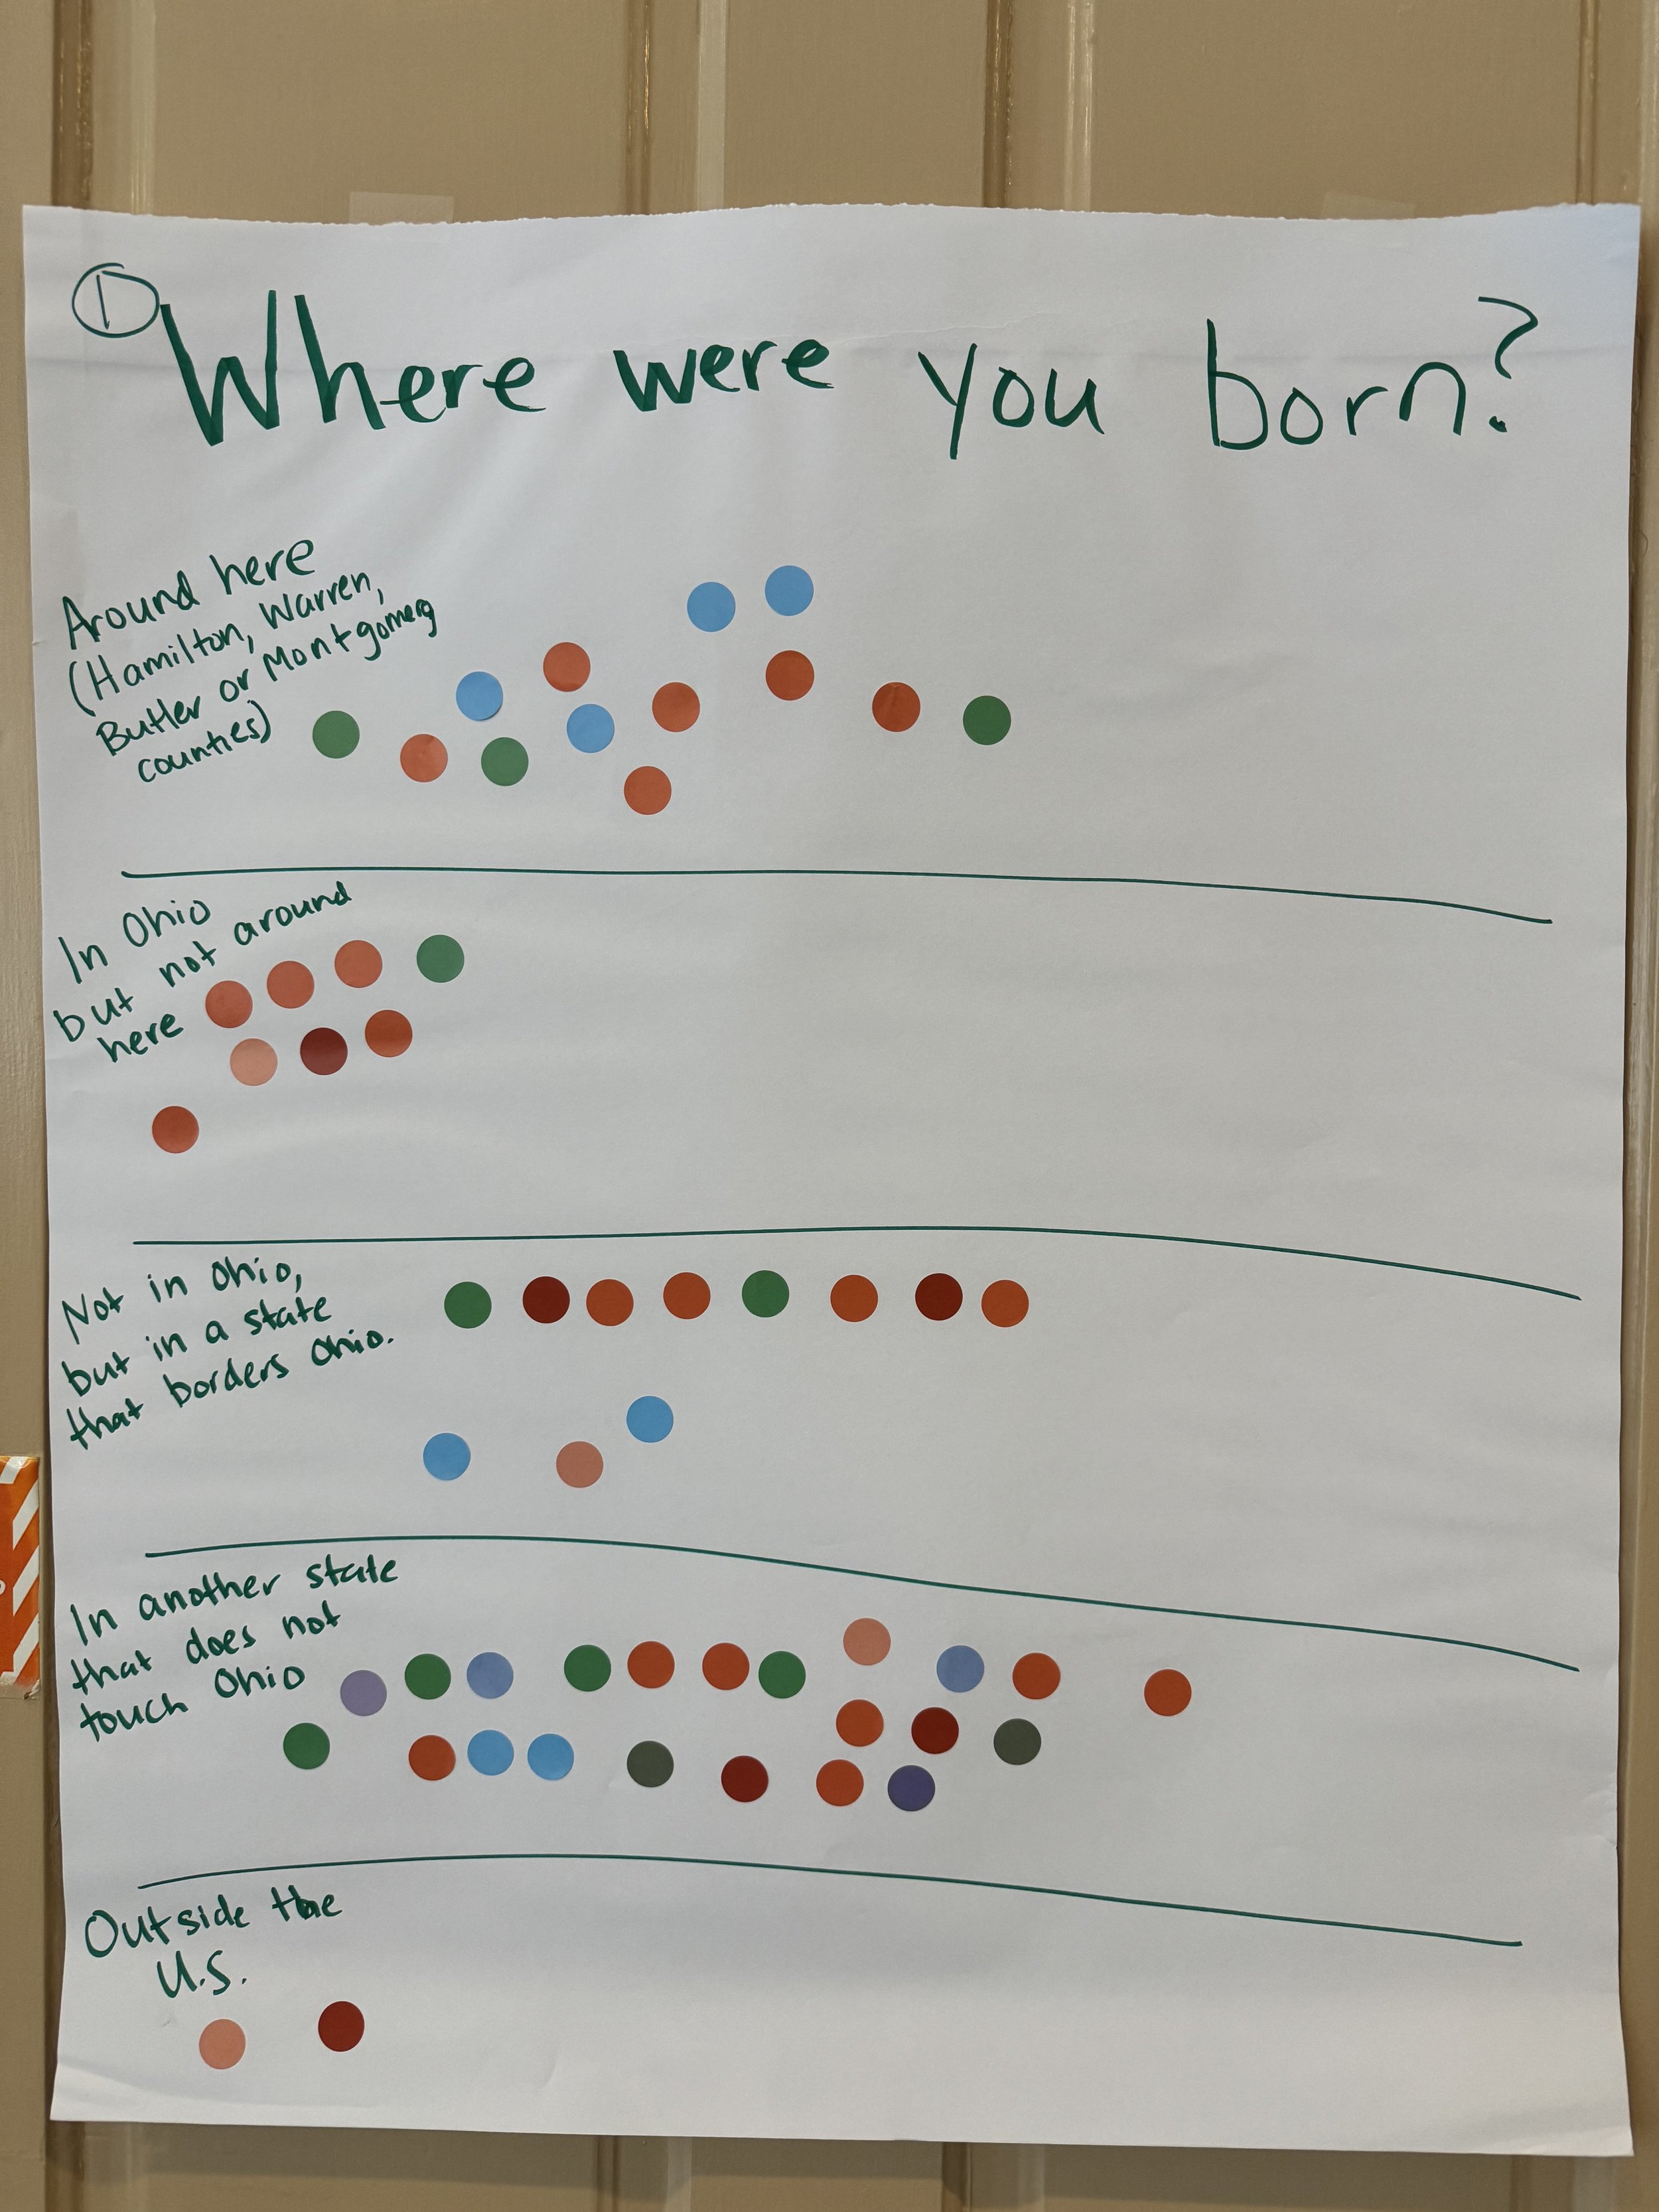
Question 1: Where were you born?
Around here: 13 (23%)
In Ohio but not around here: 8 (14%)
Not in Ohio but in a state that borders Ohio: 11 (20%)
Another state that does not border Ohio: 22 (39%)
Outside of the U.S.: 2 (3%)
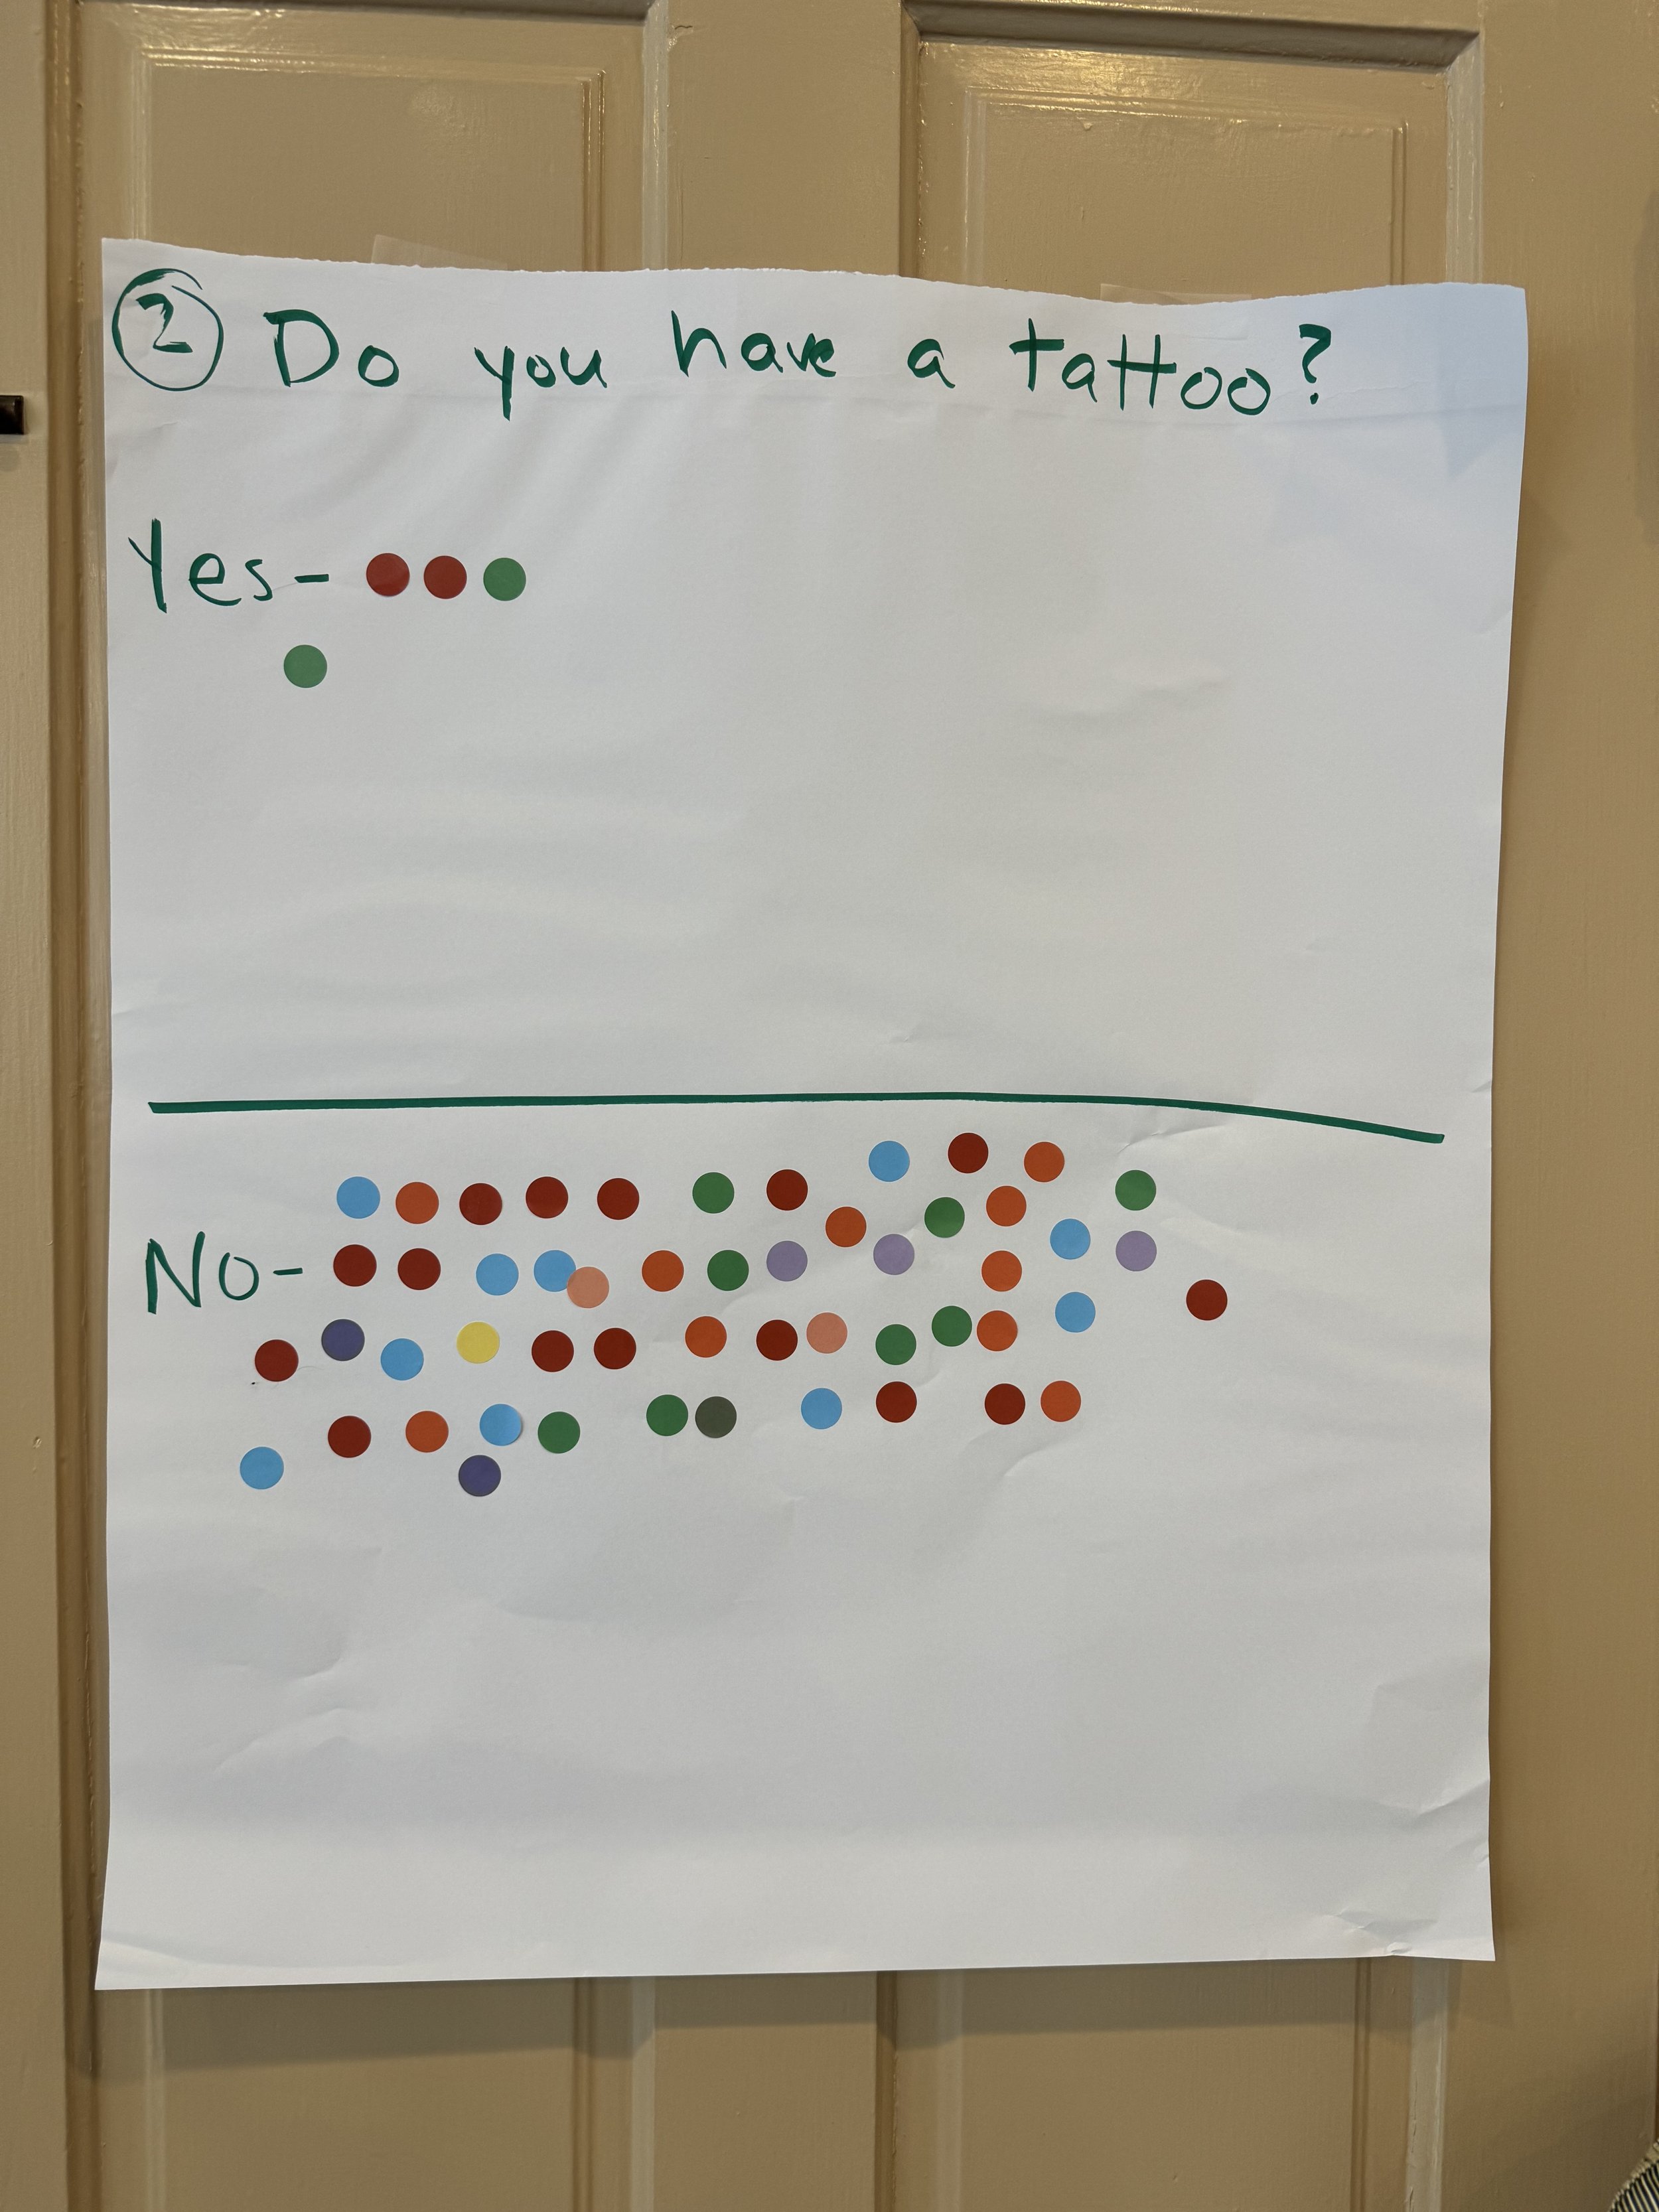
Question 2: Do you have a tattoo?
Yes: 4 (7%)
No: 52 (93%)
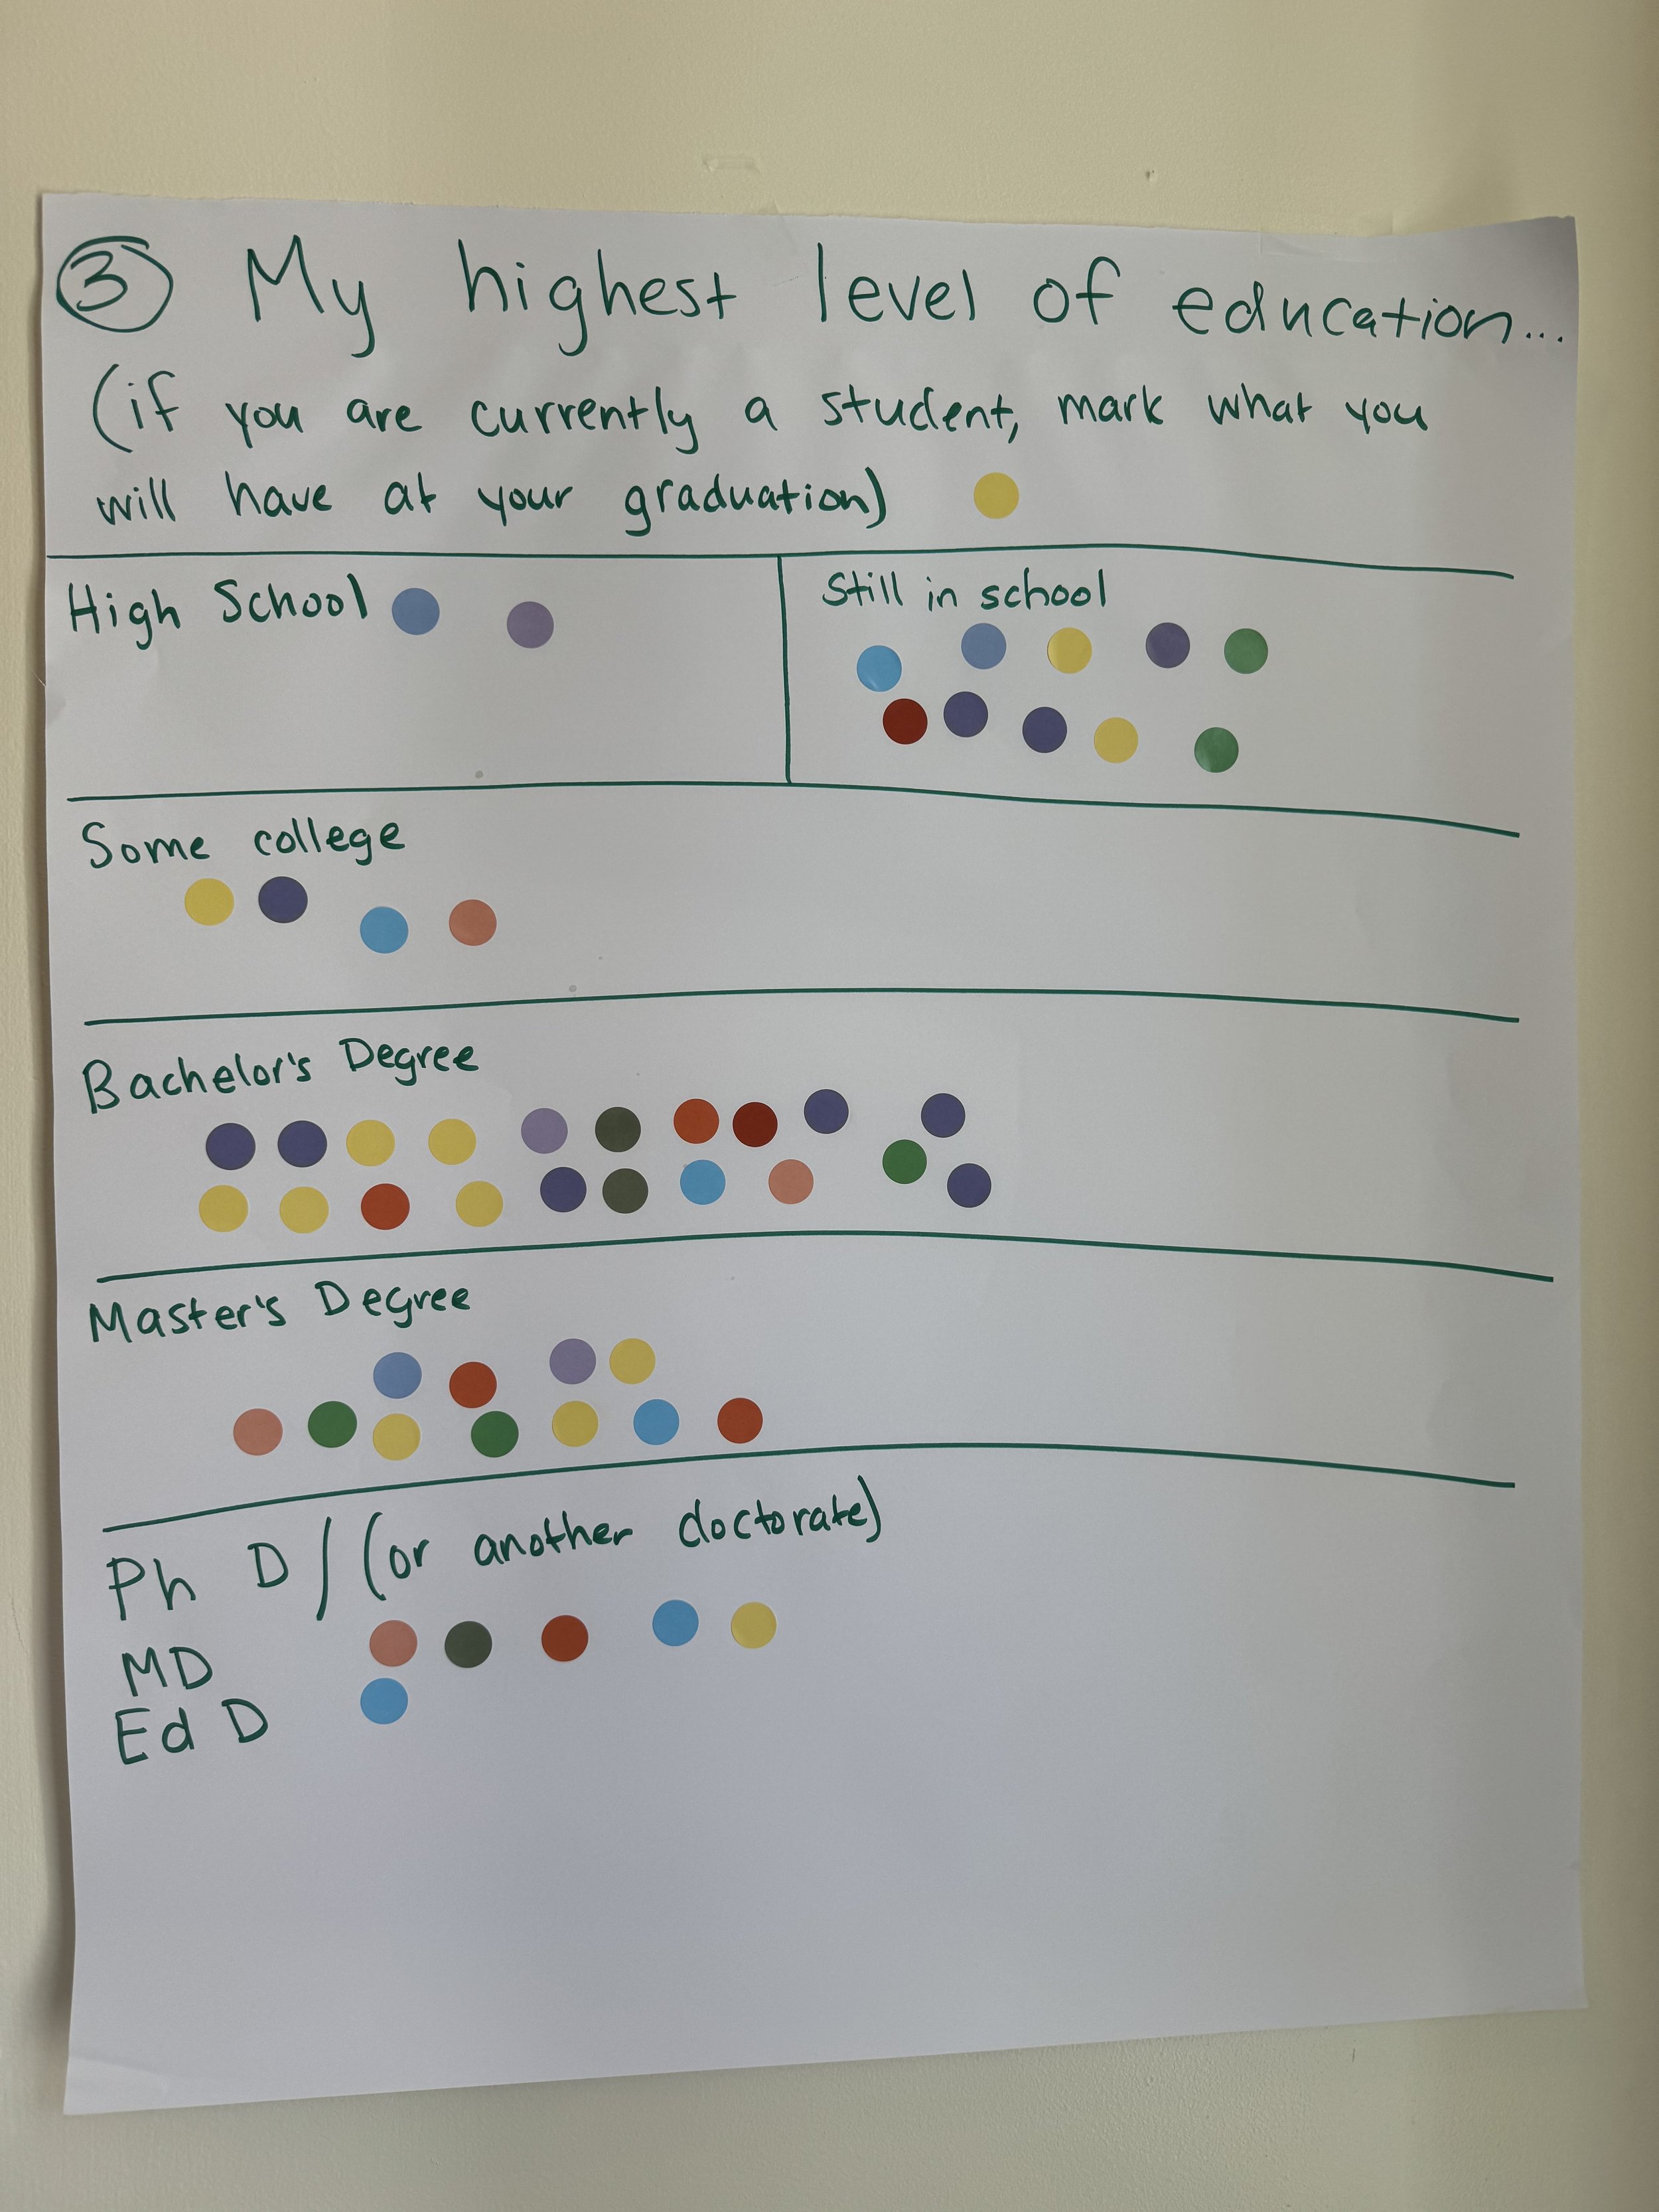
Question 3: My highest level of education
Still in school: 11 (20%)
High School: 2 (4%)
Some college: 4 (7%)
Bachelor's degree: 20 (37%)
Master's degree: 11 (20%)
Doctorate: 6 (11%)
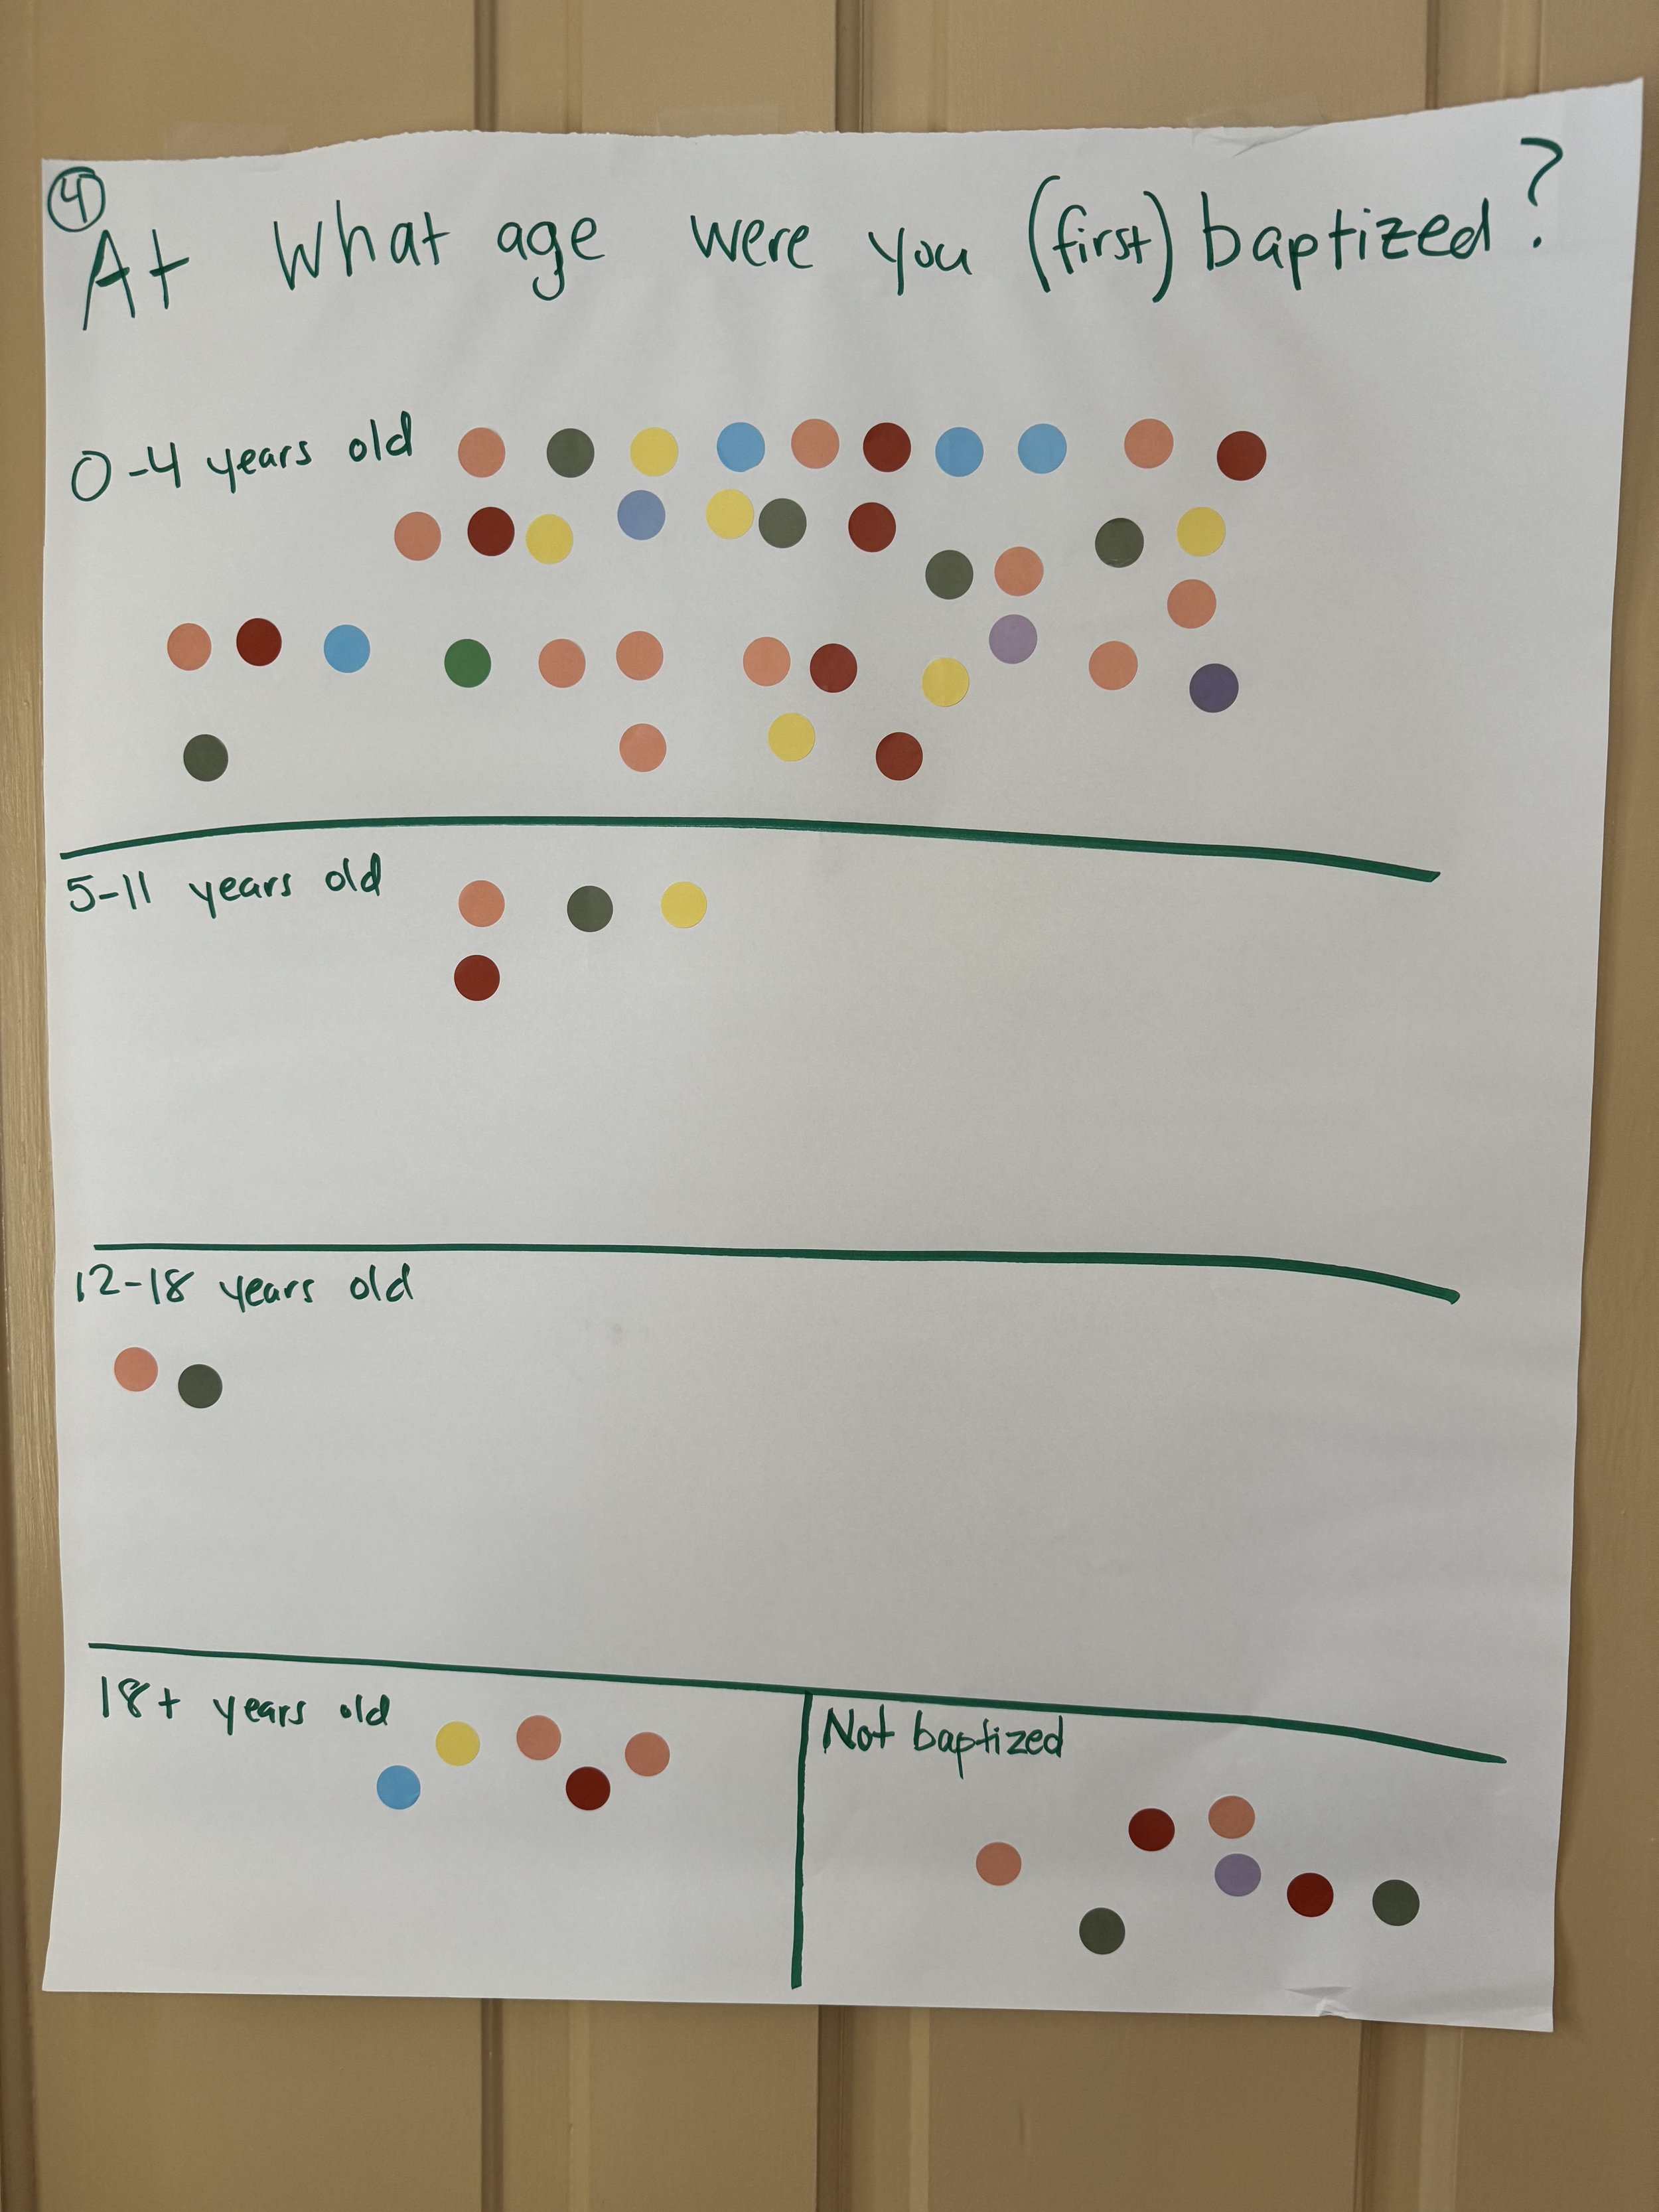
Question 4: At what age were you (first) baptized?
0-4 years old: 38 (68%)
5-11 years old: 4 (7%)
12-18 years old: 2 (3%)
18+ years old: 5 (9%)
Not yet baptized: 7 (13%)
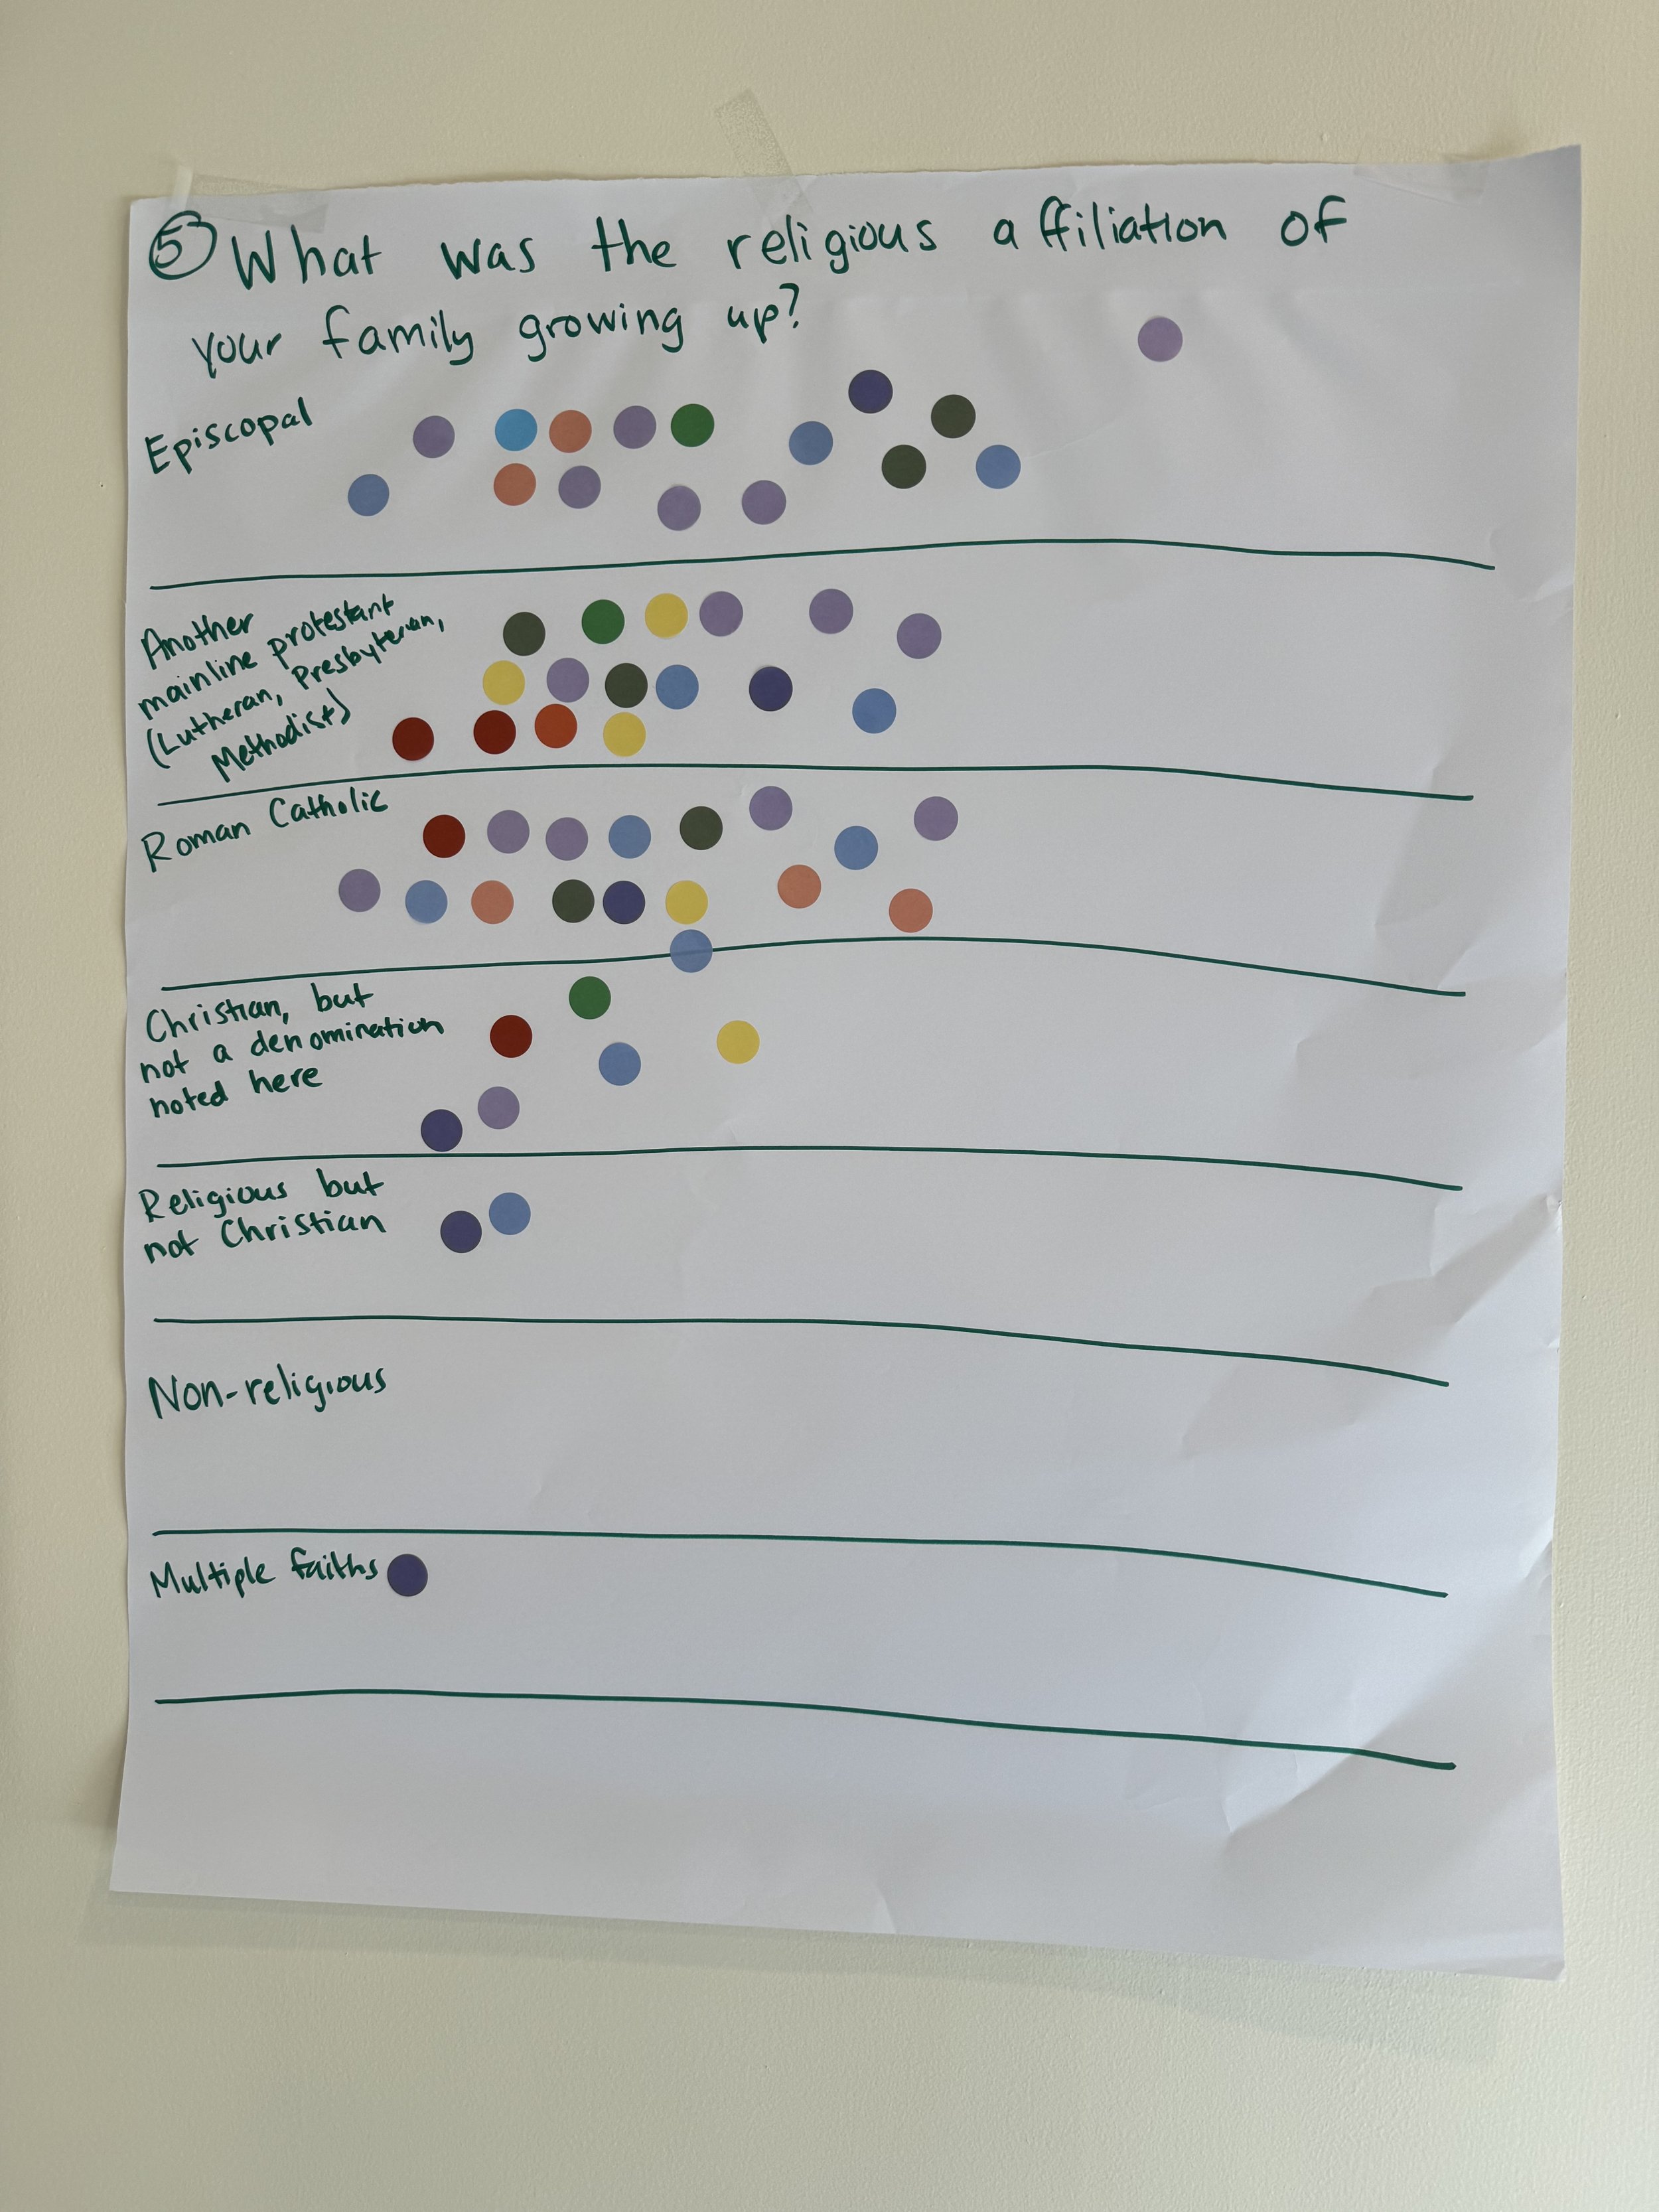
What was the religious affiliation of your family growing up?
Episcopal: 16 (28%)
Another mainline Protestant denomination: 16 (28%)
Roman Catholic: 17 (29%)
Christian not mentioned here: 6 (10%)
Religious, but not Christian: 2 (3%)
Non-religious: 0 (0%)
Multiple faiths: 1 (2%)
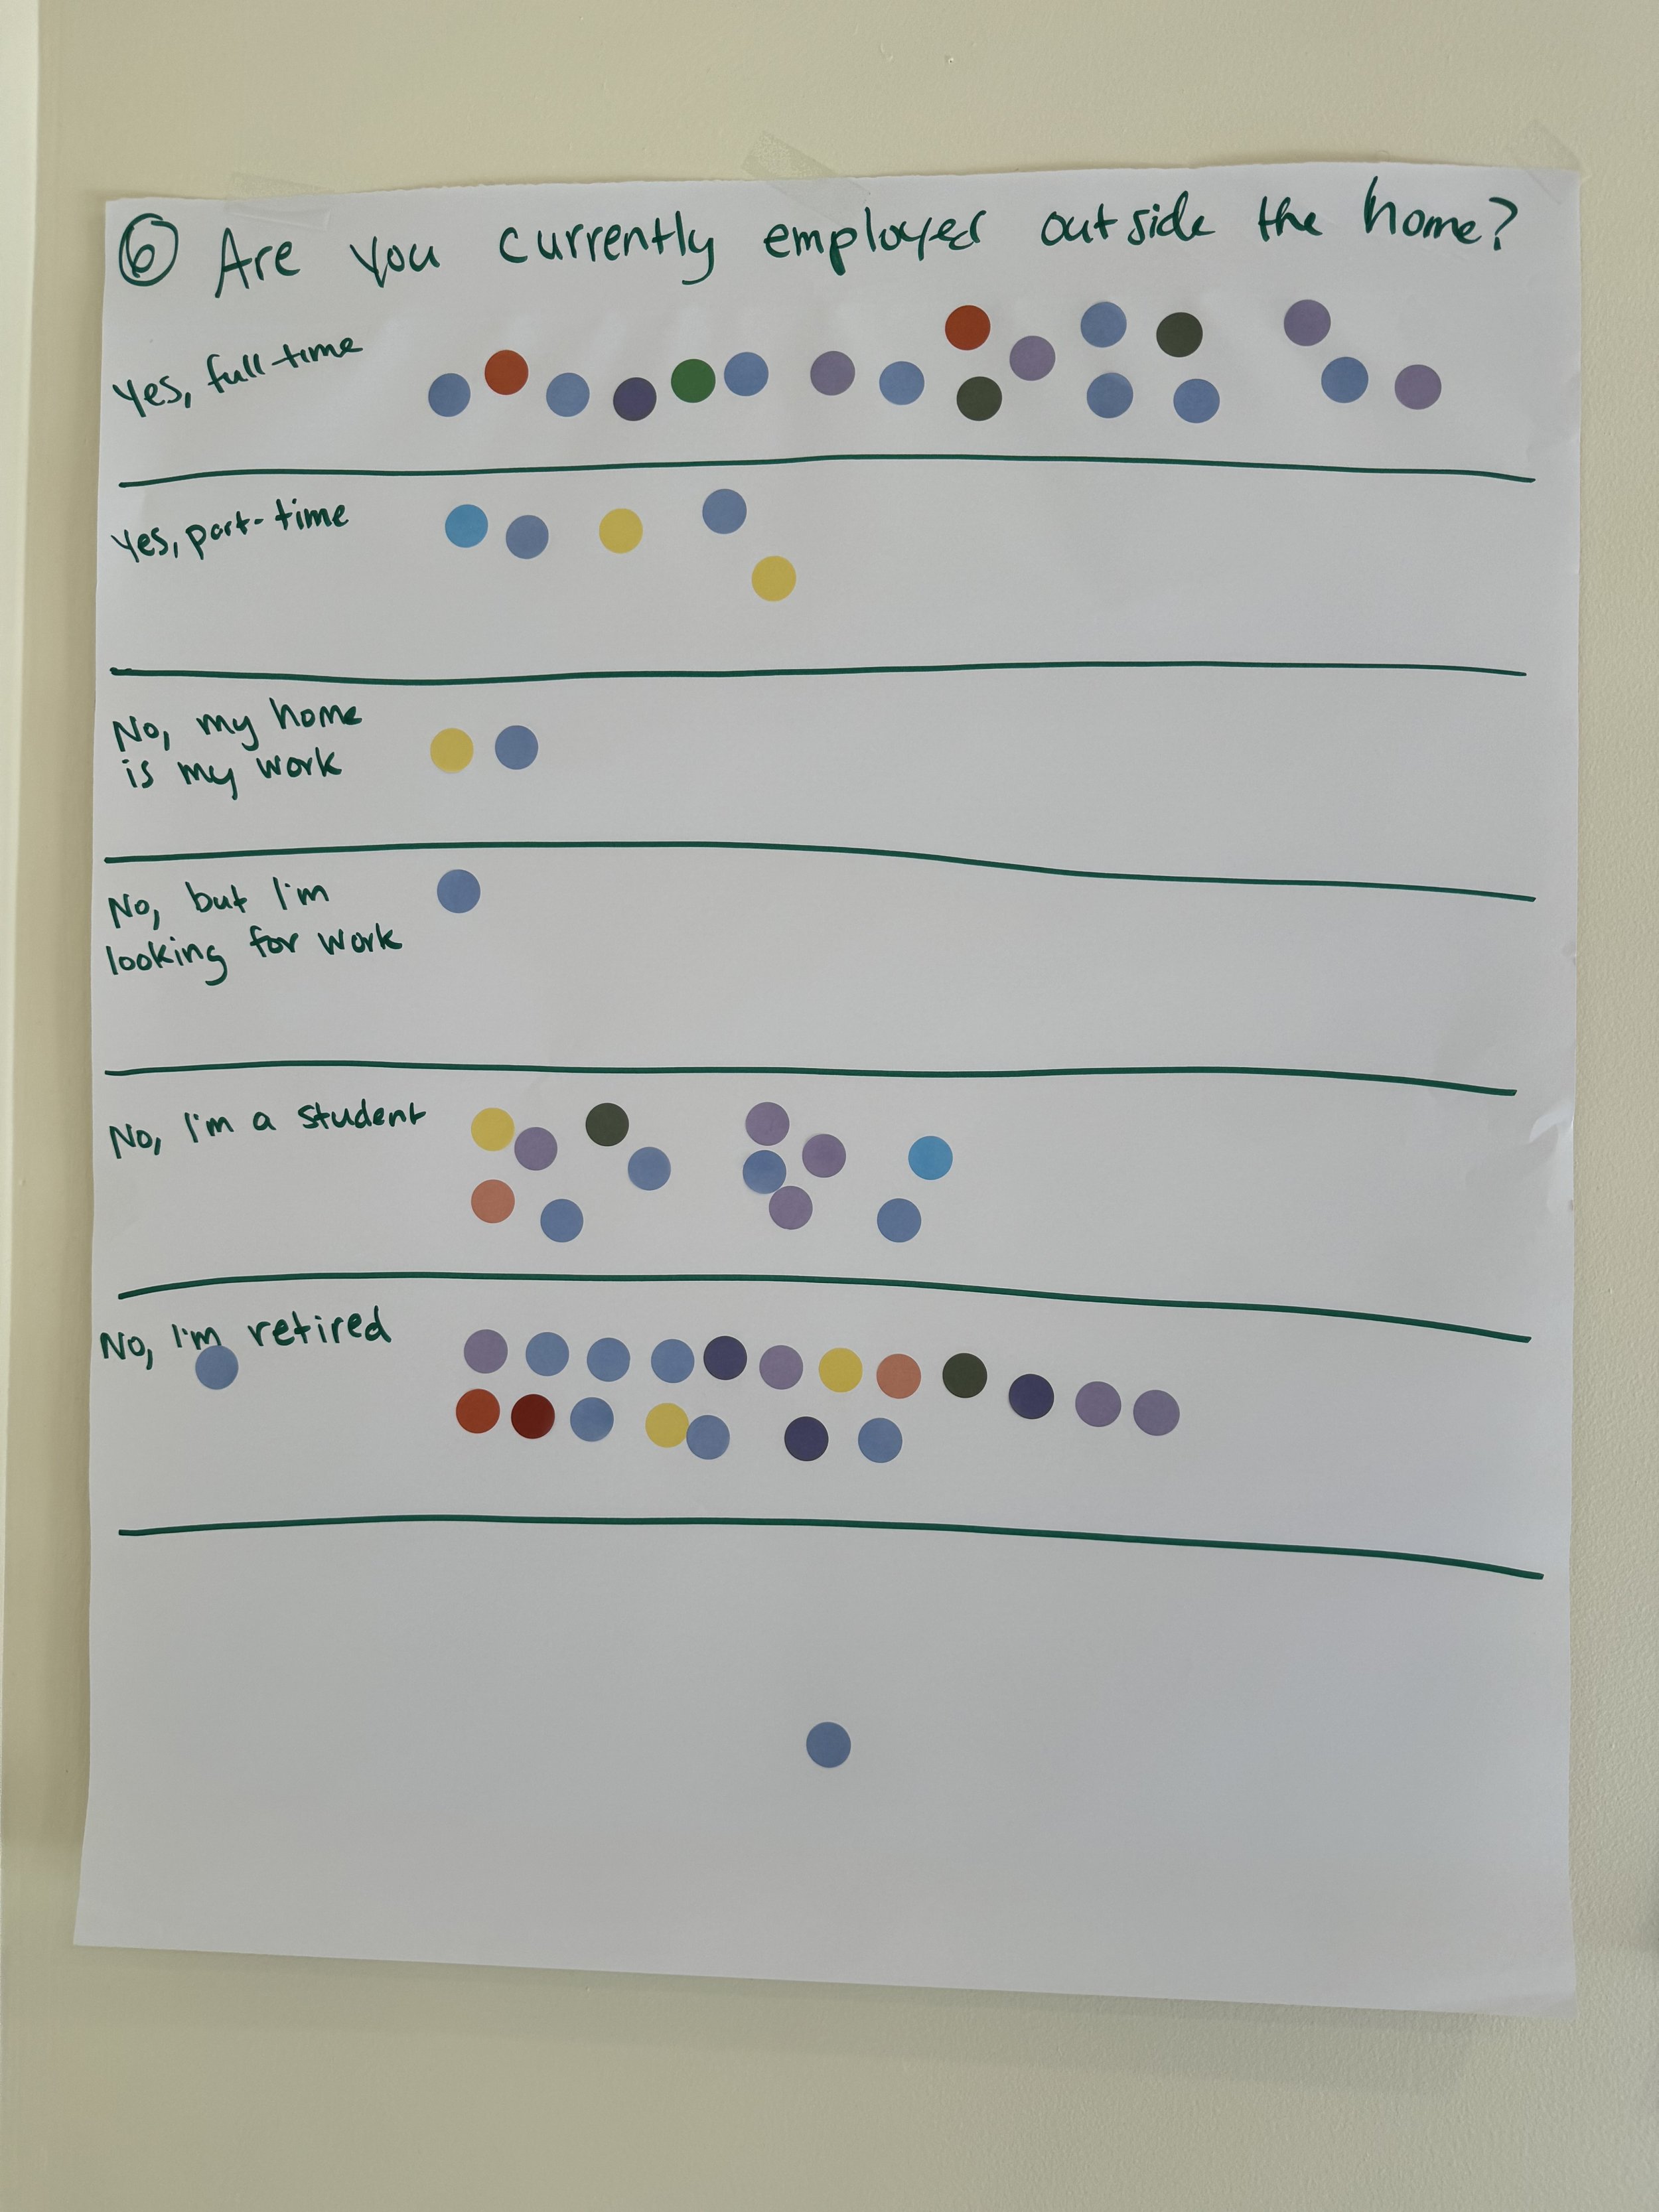
Question 6: Are you currently employed outside the home?
Yes, full-time: 18 (31%)
Yes, part-time: 5 (9%)
No, my home is my work: 2 (3%)
No, but I'm looking for work: 1(2%)
No, I'm a student: 12 (21%)
No, I'm retired: 20 (34%)
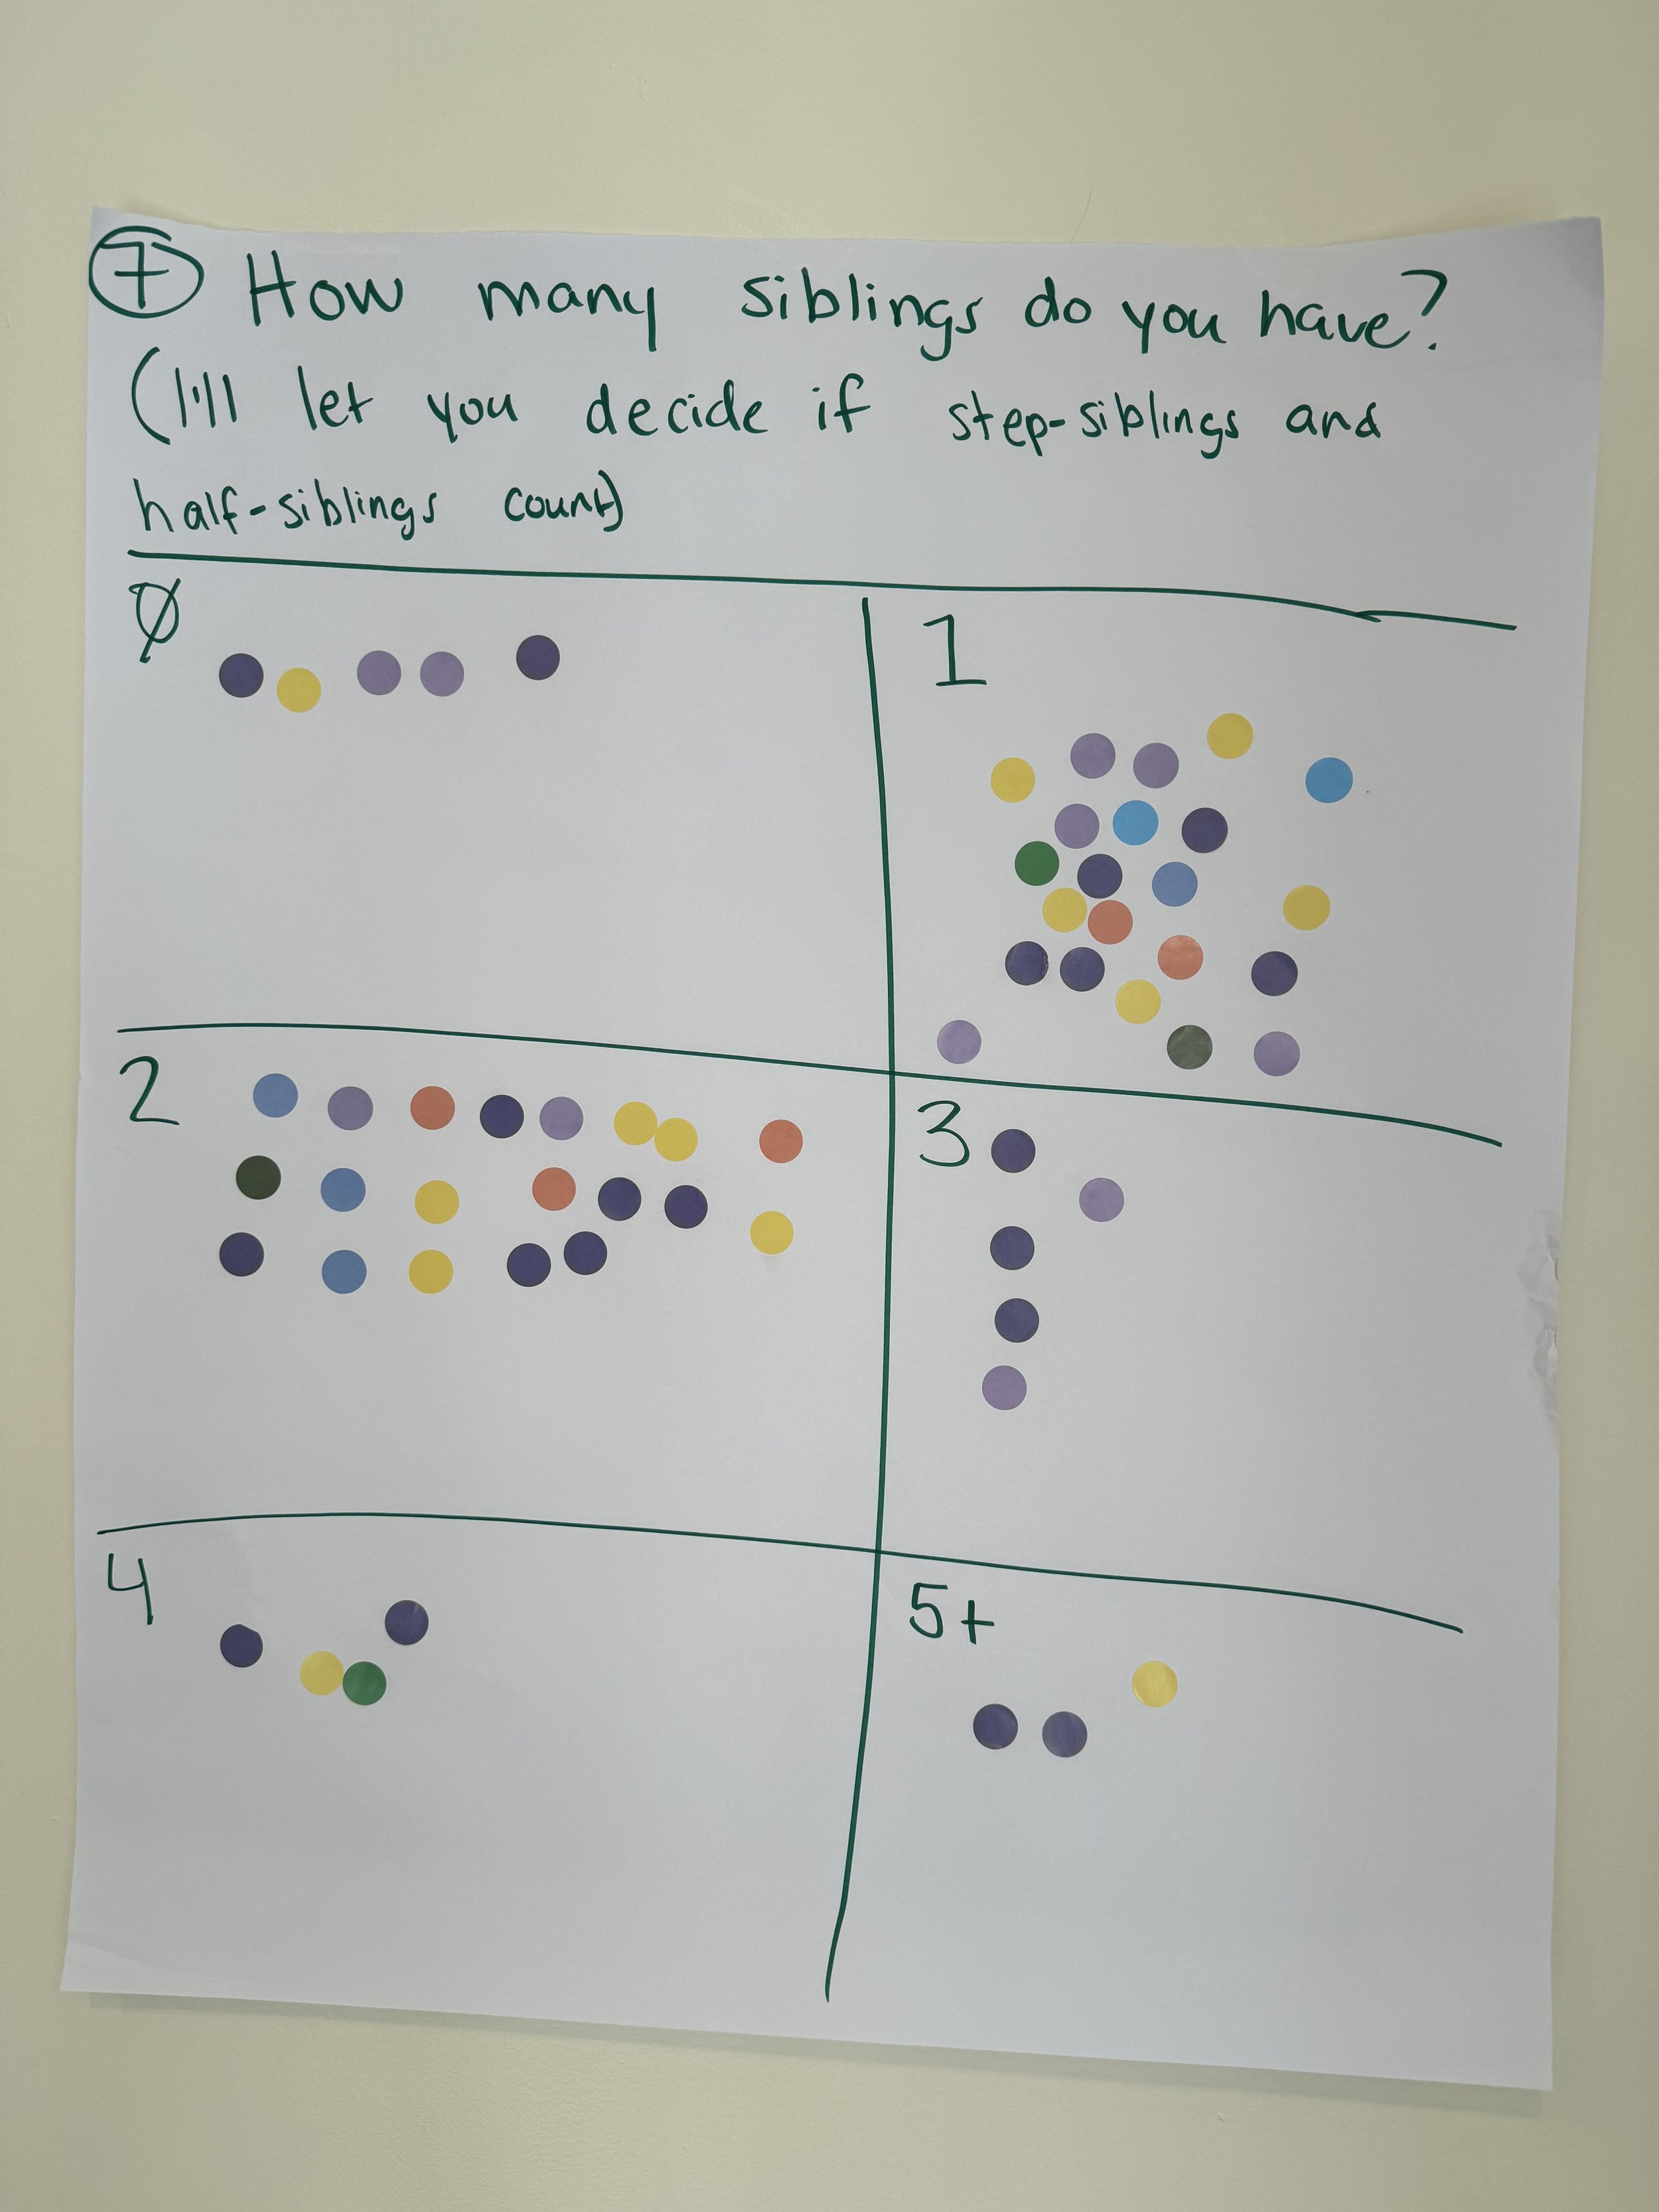
Question 7: How many siblings do you have?
0: 5 (8%)
1: 23 (38%)
2: 20 (33%)
3: 5 (8%)
4: 4 (7%)
5+: 3 (5%)
Question 8: As a teenager, how did you listen to your music?
Record player*: 20 (35%)
8-track: 1 (2%)
Cassette tape: 17 (30%)
CD: 8 (14%)
Streaming: 11 (19%)
*- some participants noted that record players weren't common in their teenage years and they used radios mainly. I counted them for record players. I did not use radio as a suggested response because it spans many generations of music consumption.
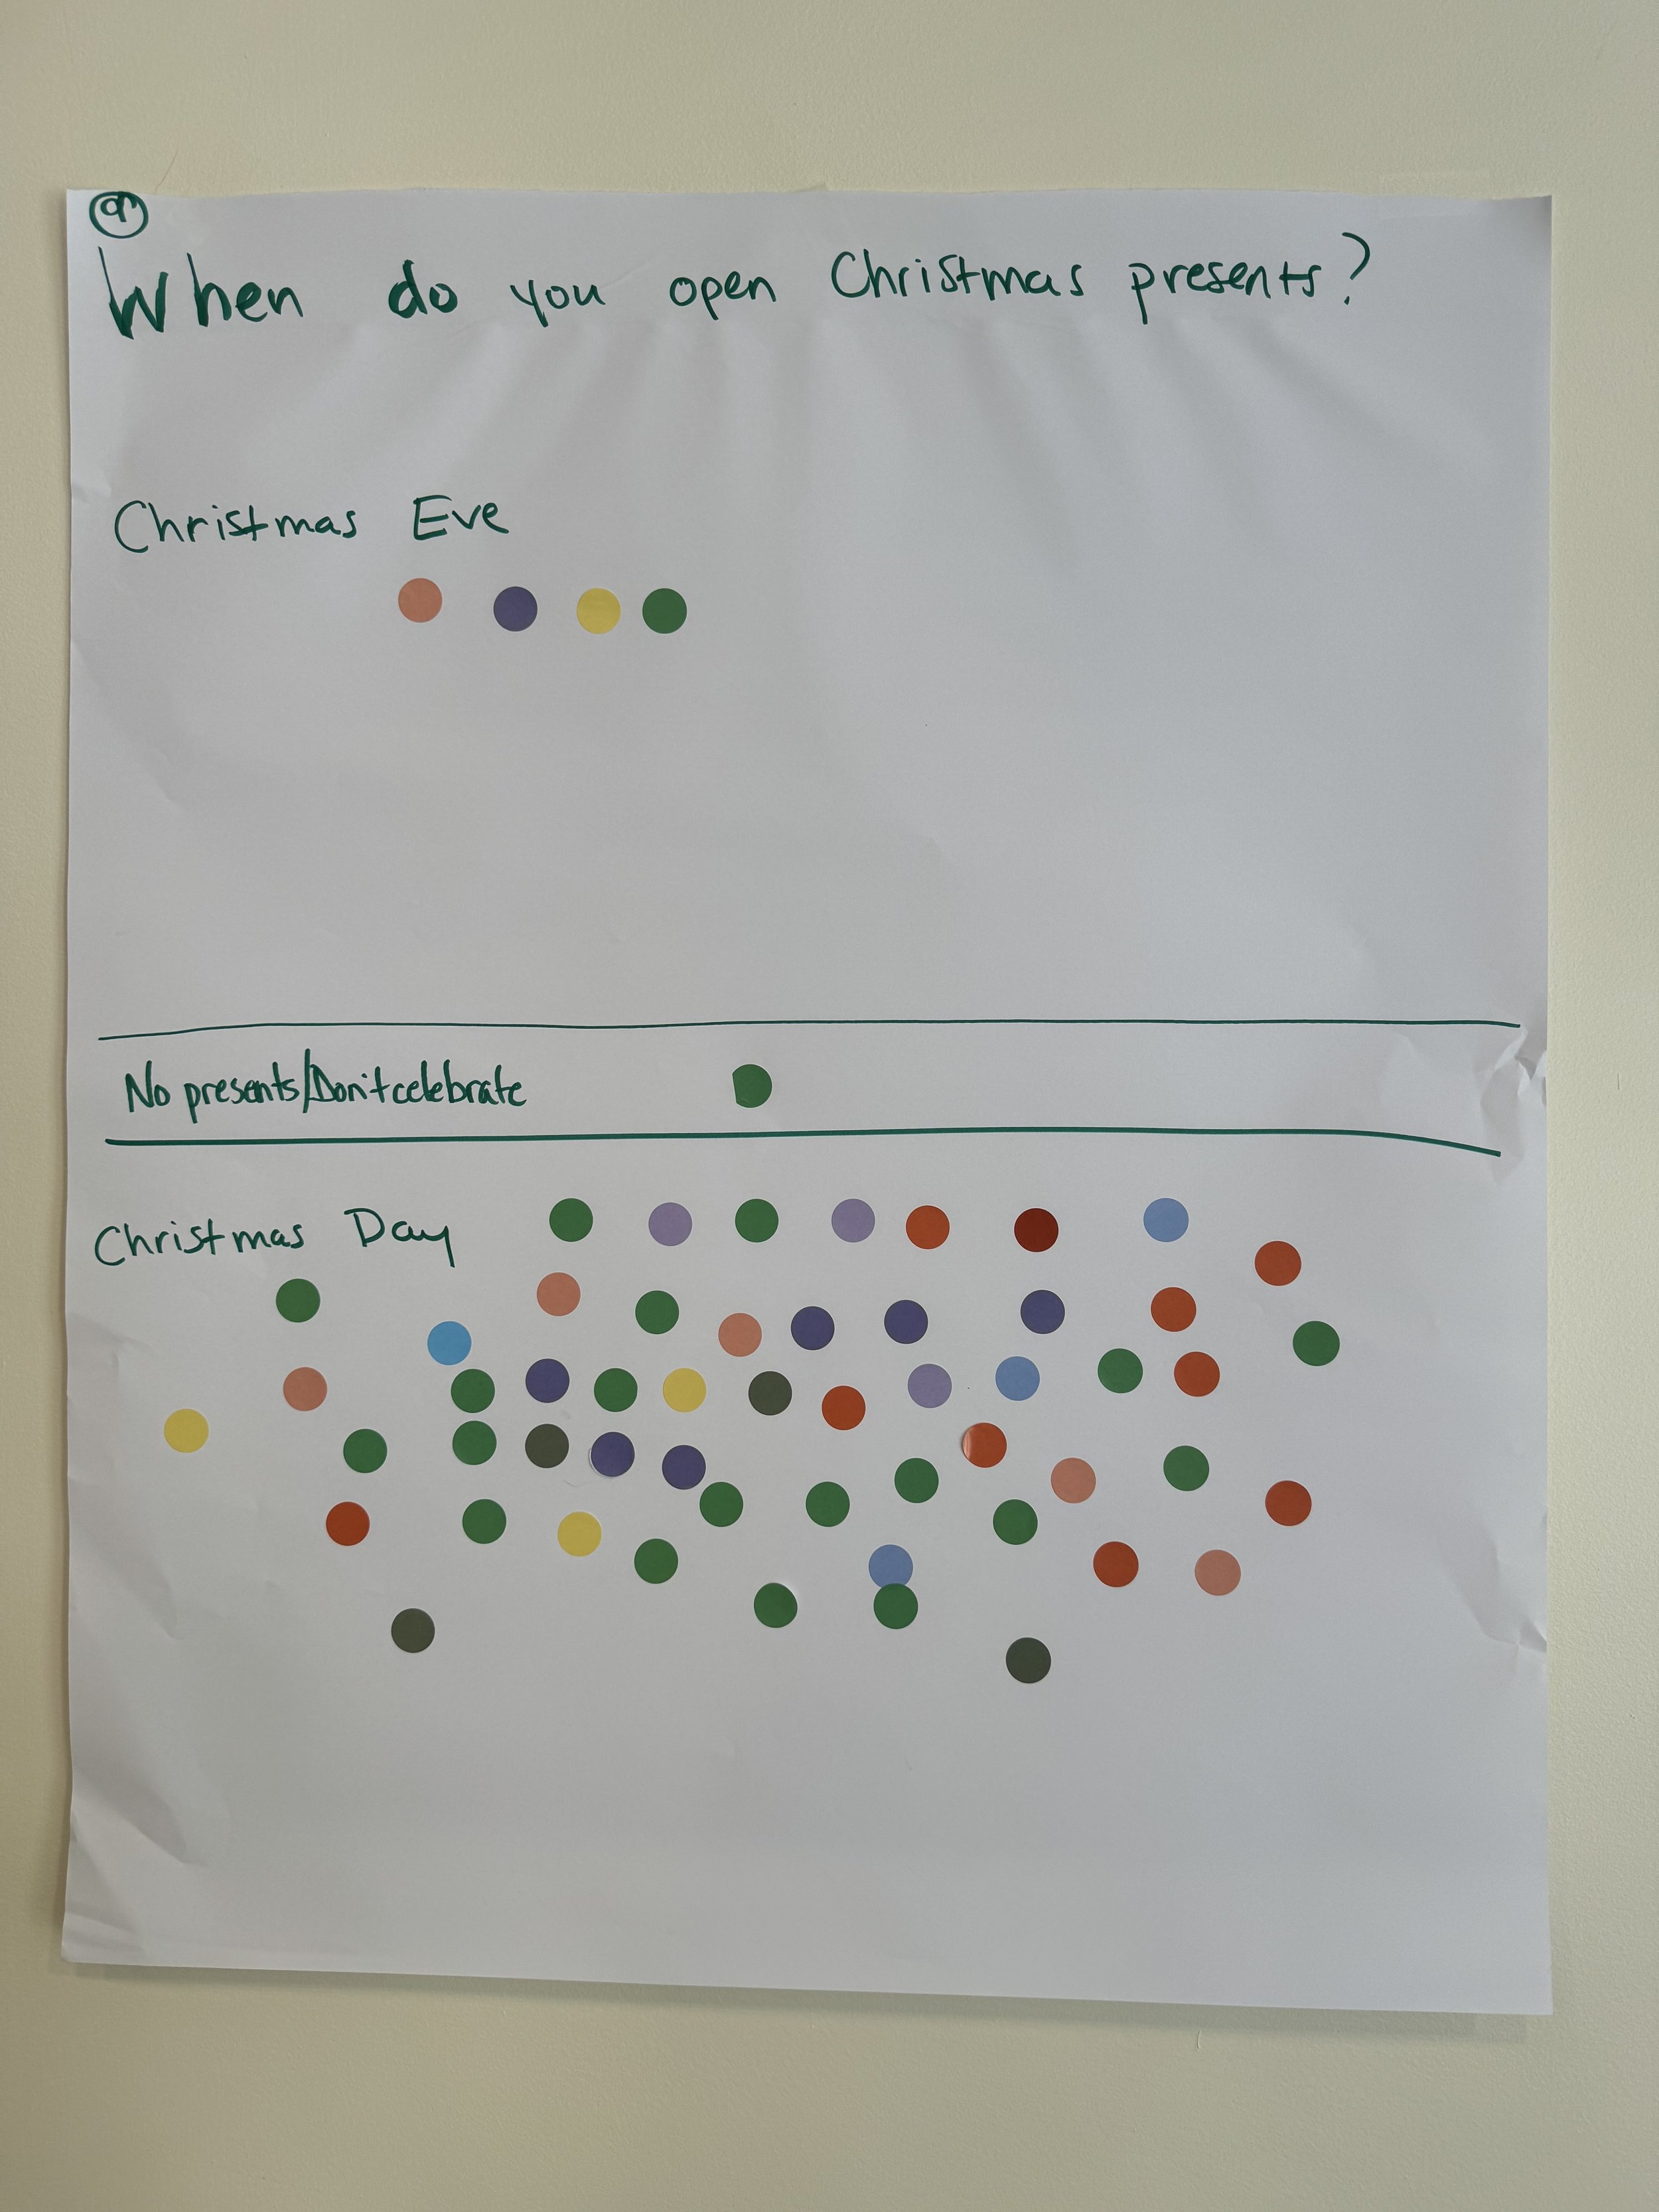
Question 9: When do you open Christmas presents?
Christmas Eve: 4 (7%)
Don't celebrate Christmas: 1 (2%)
Christmas Day: 50 (91%)
Question 10: How long ago did you start attending St. Patrick's?
<1 year: 7 (12%)
1-4 years: 18 (30%)
5-10 years: 8 (13%)
10-20 years: 16 (27%)
20+ years: 11 (18%)


